Using JVM Diagnostics (JVMD) to help tune production JVMs
By Shiraz Kanga-Oracle
Contributing Author: Shiraz Kanga, Consulting Member of Technical Staff, Oracle
Tuning a production JVM involves more than merely adding more RAM to it via the -Xmx parameter. It depends upon an understanding of how your application truly behaves in a production environment. Most JVM tuning is done by developers with a simulated load in their Development or QA environment. This is unlikely to be truly representative of the production load running on production hardware with regards to proper JVM tuning.
One of the tools that actually contains real-world production data is JVM Diagnostics (JVMD). Hence it is a good idea to use data collected by JVMD for tuning your production JVMs. Note that JVMD is a component of Oracle Enterprise Manager, licensed as part of both Weblogic Management Pack and the Non-oracle Middleware Management Pack.
In this document we are primarily addressing the Hotspot JVM. There are several aspects of tuning this JVM that we will look into:
Tuning Heap Size
The main parameters needed to tune heap size are:
- -Xms
[g|m|k] is the initial and minimum size of the Java heap - -Xmx
[g|m|k] is the maximum possible size that the Java heap can grow upto
Figure 2. Heap after GC and Garbage Collection Overhead for a specific JVM
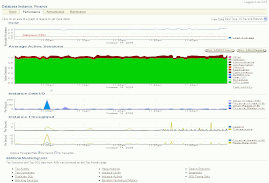
The Java Heap size here refers to the total size of the young and the old generation spaces. To start, take a look at the Heap usage chart (Figure 1) of your production JVM under maximum load in the JVMD Performance Diagnostics page. You should see some patterns in the minimum and the maximum heap sizes over time. You can use this data as a rough guide for your choice of -Xms and -Xmx with a reasonable amount of padding. After setting these you should start monitoring the garbage collection charts of your production JVMs (Figure 2) in the JVMD Live Heap Analysis page. It is useful to look into the JVMD metric called "Heap use after GC" which provides a good reflection of the actual amount of heap memory being used by your application. Ideally this metric should remain relatively steady over time with only few full garbage collections occuring. If there are too many full garbage collections then performance of your production application is impacted since GC is done by blocking threads that take a while to scan the entire heap. You can monitor this metric with the JVM GC Overhead% chart on the same page of JVMD. Garbage collection overhead is the percentage of total time spent in garbage collection. Increasing -Xmx can help to make these happen less frequently but actually it is time to dig deeper into your tuning options.
The key questions that you need to answer are - How frequently does garbage collection take place, How long does each collection take and what is the actual memory used (i.e. heap after GC). Also be sure that you NEVER make the heap size larger than the available free RAM on your system as disk will decrease performance as RAM will start getting swapped to disk.
The Sun HotSpot JVM relies on generational garbage collection to achieve optimum performance. The -XX:SurvivorRatio command line parameter could further help in tuning garbage collection.
The Java heap has a young generation for newly created objects and an old generation for long lived objects. The young generation is further subdivided into the Eden space where new objects are allocated and the Survivor space where new objects that are still in use can survive their first few garbage collections before being promoted to old generations. The Survivor Ratio is the ratio of Eden to Survivor space in the young object area of the heap. Increasing this setting optimizes the JVM for applications with high object creation and low object preservation. In applications that generate more medium and long lived objects, this setting should be lowered from the default and vice versa.
For example, -XX:SurvivorRatio=10 sets the ratio between each survivor space and eden space to be 1:10. If survivor spaces are too small, they will overflow directly into the old generation. If survivor spaces are too large, they will be empty. At each GC, the JVM determines the number of times an object can be copied before it is tenured, called the tenure threshold. This threshold should be set to keep the survivor space half full.
Most tuning operations represent a trade-off of some type or another. In the case of garbage collection the trade-off usually involves the memory used v/s throughput and latency.
- The throughput of a JVM is measured in terms of the time spent doing garbage collection vs. the time spent outside of garbage collection (referred to as application time). It is the inverse of GC overhead mentioned above and represents the amount of work done by an application as a ratio of time spent in GC. Throughput can be tuned with -XX:GCTimeRatio=99 where 99 is the default which represents a 1% GC overhead.
- Latency is the amount of time delay that is caused by garbage collection. Latency for GC pauses can be tuned by specifying rhe maximum pause time goal with the command line option -XX:MaxGCPauseMillis=
. This is interpreted as a hint that pause times of milliseconds or less are desired. By default, there is no maximum pause time goal. If a pause time goal is specified, the heap size and other garbage collection related parameters are adjusted in an attempt to keep garbage collection pauses shorter than the specified value. Note that these adjustments may cause the garbage collector to reduce the overall throughput of the application and in some cases the desired pause time goal cannot be met.
Some lesser-known options are about permanent generation space which is used by the JVM itself to hold metadata, classes structures and so on:
- -XX:PermSize=
[g|m|k] is the initial and minimum size of the permanent generation space. - -XX:MaxPermSize=
[g|m|k] is the maximum size of the permanent generation space. If you ever get the message java.lang.OutOfMemoryError: PermGen space then it means that your application is loading a very large number of classes and this should be raised. - -Xss=
[g|m|k]is the size of the thread stack. Each thread in a Java application has its own stack. The stack is used to hold return addresses, arguments to functions and method calls, and so on. The default stack size setting for a thread in Java is 1MB. In a highly multi-threaded system, like an application server at any given point in time there are multiple thread pools and threads that are in use so this may need to be reduced. Since stack size has to be allocated in contiguous blocks and if the machine is being used actively and there are many threads running in the system you may encounter an OutOfMemory error even when you have sufficient heap space. Recursive code can quickly exhaust the stack and if you use such code then you may need to increase the -Xss setting. However, if you see java.lang.OutOfMemoryError: unable to create new native thread then you may have too many threads, or each thread has a large stack; so you may need to decrease it.
Tuning Garbage Collection Algorithm
Garbage collection is expensive. Generational garbage collectors have the JVM memory divided into several spaces.
- Eden space: All objects are placed here when first created
- Survivor spaces: One or more regions where objects mature
- Tenured space: Where long lived objects are stored
- Permanent generation: This area is only used by the JVM itself to hold metadata, such as data structures for classes, methods, interned strings
One thing that people often forget to try, is to lower the amount of garbage being created in the first place. There are a lot of ways to do this which are specific to the application/code that is being written. This often involves techniques such as using StringBuilder/StringBuffer instead of Strings, lowering the amount of logging, etc.
There are several GC algorithms which are available to be used in a Java VM. The following command line options allow to use a specific GC algorithm:
- -XX:+UseSerialGC uses a single threaded, young generation, and old generation garbage collector (Normally this is a poor choice and should be used only for small Java heap sizes such as -Xmx256m or smaller)
- -XX:+UseParallelGC utilizes a multithreaded (parallel) garbage collector for the young generation and a single-threaded garbage collector for the old generation space in parallel.
- -XX:+UseParallelOldGC uses a multithread garbage collector for both the young and old generations.
- -XX:+UseParNewGC -> enables a multithreaded, young generation garbage collector
- -XX:+UseConcMarkSweepGC -> enables the VM’s mostly concurrent garbage collector. It also auto-enables -XX:+UseParNewGC (use if If you are not able to meet your application’s worst case latency requirements due to full garbage collection duration being too long)
- -XX:+UseG1GC -> garbage first collector (default in java 7, can be also used in latest releases of Java 6)
In practice, the default in Java 6 is ParallelGC and in Java 7 it is the G1GC. Changing the algorithm requires detailed analysis of the application behavior. If you see a nice regular sawtooth chart in the heap usage you may not need any changes at all. If not, we recommend trying out each GC algorithm under a realistic load and then comparing it to the default algorithm's behavior under the same load. Usually you will find that the default algorithm outperforms the new setting and that there is no reason to change it.
As you can see, tuning the JVM and it's garbage collectors is largely a trade-off between space and time. If you had infinite heap space then you would never need to collect garbage. Inversely, if you could tolerate infinite time delays, then you could run a cleanup as frequently as you like and keep the heap compact. Clearly, both those situations are impossible. Finding the right middle ground that is right for you requires careful balancing act based on understanding how GC works and what the application requires.
References:
Java SE 6 HotSpot Virtual Machine Garbage Collection Tuning http://www.oracle.com/technetwork/java/javase/gc-tuning-6-140523.html


